Features
SPECIFICATIONS
Solar simulator specifications:
Bands: 400-500, 500-600, 600-700,
Light control: USB
Automatically intensity light Control: 0.1 to 1000 W/m2
Power Requirements: 230 VAC, 50 Hz, 300W
Operating Temp Range: 20°C to 30°C
Humidity :<85%, relative, non-condensing
Certificate: ISO 9001 :2015, CE CERTIFICATE
Illumination Area: 51mmX51mm
Total Power Output: 1.0 sun
Uniformity Classification:A - IEC 60904-9 2007, JIS C 8912,
Spectral Match3
Operating Temp Range: 20°C to 30°C
Solar IV characterization system specifications
-Controlled by :computer.
-Automatically measure: I-V characteristics from 1 W/cm2-1000 W /cm2 by adjusting light intensity with step of 1 mW/cm2
-The intensity of solar simulator should automatically adjust by solar IV system
-Measure I-V characteristics curve of the device, Solar Cell I-V characteristic curve, Power-voltage curve, lsc-Solar
-Automatically measure open circuit voltage Voc and short circuit current, ISC , Shunt resistance (Rsh) • Conversion efficiency (n), Maximum power output (Pmax), Voltage at Pmax (Vmax), characteristic resistance, Rch , Fill factor (FF) • Series resistance (Rs)
-Measures automatically current-voltage (I-V) of solar cell under various solar lights
Source meter specifications
Voltage range: -20 V to +20 V
Current range: 10 nA to 150 mA
-Automatic shuttering system which automatically changes solar light from 1 W/m2 to 1000 W/m2
-Sample holder and it is comprised of two probes. Holder size should have 132.5mmx132.5mm.
-Software to control measurements and analysis of data.
I-V system, source meter
-Voltage range: -20 V to +20 V
-Current range: 10 nA to 150 mA
- I-V Solar IV software
- Solar cell probes
- Solar cell probes
- Calibrated Reference solar cell
-Factory calibrated AM1.5G spectral match
-Factory calibrated intensity
-Front panel LED Fault indication
-USB Communications
-Meets Class AAA specification for IEC 60904-9, JIS C 8912, and ASTM E 927-05
-2” X 2” illumination area at 1 sun
-PV Cell Placement Indicator
Delivery scopes:
-Solar simulators
-IV characterization system
-Source meter
-Sample holder
-Connections
-Solar IV characterization Software
-Solar Life-Time Software
-Transient photocurrent software
-Photovoltaic mechanism analysis software
TECHNICAL DATA AND CALIBRATION RESULTS
PHOTOVOLTAIC I-V TEST RESULTS
-a-
SPECTRAL MATCHING OF SOLAR SIMULATOR
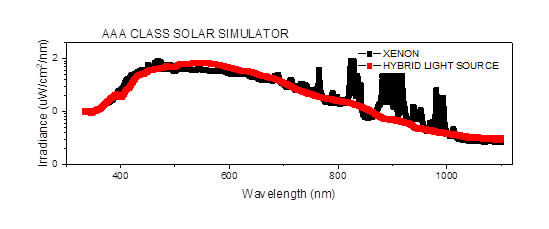
HYBRID LAMP SOURCE VS XENON
Light source do not have any spark and it is better than Xenon lamp
IV unit
The IV unit is used to characterize photovoltaic devices.
o Computer (PC)
o Software to measure the current-voltage curve, and parameters like: Voc, Isc, Vmax, Imax, Pmax, Voc slope, Rp, FF
o Current-Voltage Measurement System (IV Tester)
o Parallel JV and stability measurements.
o Perform I-V measurements between -10 V and 10 V, with voltage step sizes as low as 500 µV.
o Test data can be output as TXT file and/or .csv file
Probe holder
Sample holder customized. No restriction on geometry.
Probe holder has two electrodes to measure current voltage characteristics of the solar cells
Sourcemeter
Current range: 10nA-500 mA
Voltage range: -10V to -10V or more
The temperature of light illumination area is 25-27 oC. Do not thermocouple to reader to monitor temperature (temperature monitor also can be provided)
Solar simulator system is automatically cooled. Do not water chiller if required by system
All in one computer for software
Software analyzes all photovoltaic parameters such as
Open circuit voltage (Voc), Short Circuit current (Isc), Fill factor (FF), Voltage at Pmax (Vmax)
Current at Pmax (Imax) , Maximum power output (Pmax), Shunt resistance (Rsh) •
Series resistance (Rs), Characteristic resistance of solar cell (Rch) •
Solar cell efficiency (n)
Warranty : 18 months
Reference cell
Reference cell is used to measure 1000 W/m2, 1 SUN
It was certificated y national accreditation center of US.
SOFTWARE OF SOLAR SIMULATOR SYSTEM
• Measurements:
• Short circuit current, Isc,
• Open circuit voltage, Voc,
• Open circuit current density, Jsc
• Maximum power, Pmax,
• Maximum voltage Vmax,
• Maximum current, Imax
• Efficiency η,
• Fill Factor FF,
• Series resistance Rs,
• Shunt resistanceRsh,
• Characteristic resistance of solar cell Rch
• Automatic IV measurement under steady-state conditions from 1 mW/cm2 to 100 mW/cm2 (optional, it depends to solar simulator configuration)
• IV characteristics overlay display.
• Forward scan/ Reverse scan/ Automatic forward and reverse scanning measurement
• Automatic polarity reversal test.
• Semi-log display of photocurrent-voltage characteristics
• Voltage and current monitoring measurement
• Solar irradiance configuration recipe.
• File export format: CSV/TXT File
Certified
SOLARPHYSICS Solar Simulator ships with a performance certificate according to the applicable ASTM, IEC and JIS standards
PhotoVoltaic Calibration Lab
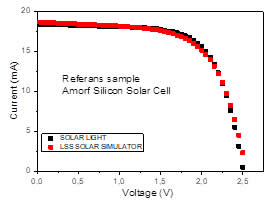
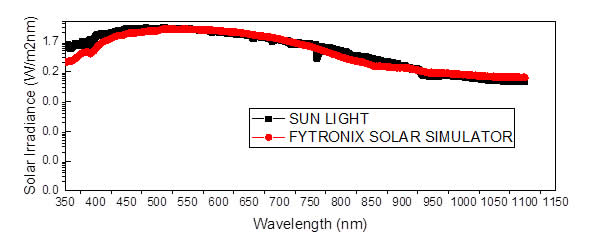
We are proud to house and manage one of the few commercial photovoltaic and calibration test laboratories in the world. The SOLARPHYSICS Photovoltaic Calibration and Test Laboratory is accredited by NAC to the ISO/IEC 17025 Standard, using state of the art equipment for measurements in accordance with ASTM E948 and E1021. The lab welcomes requests for prototype PV device performance measurements or PV reference cell calibrations. Flexible scheduling and rapid turnaround time ensure minimal downtime to time sensitive devices. LSS solar simulator generates a continuous light spectrum corresponding to a class AAA spectrum. This system is designed to illuminate any type of solar cell up to 25 x 25 mm or more. LSS solar simulator generates a continuous light spectrum whose intensity varies from 1 W/m2 to 1000 W/m2. The simulator and I-V measurement system are controlled by the computer.
Common Measurements made in I/V Characterization of photovoltaic devices
Dark I/V measurements are commonly used to analyze the electrical characteristics of solar cells. Dark I/V measurements are more sensitive than light I/V measurements in determining parameters such as series resistance, shunt resistance, diode factor, and diode saturation currents.
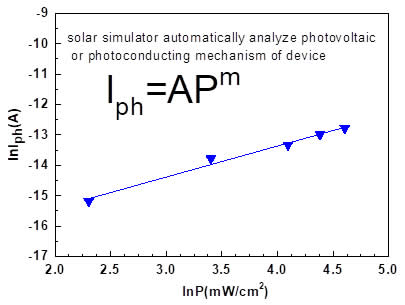
Solar simulator automatically determine the photovoltaic parameters as follows
Open circuit voltage (Voc)
Short Circuit current (Isc)
Fill factor (FF)
Voltage at Pmax (Vmax)
Current at Pmax (Imax)
Maximum power output (Pmax)
Shunt resistance (Rsh) •
Series resistance (Rs) •
Characteristic resistance of solar cell (Rch) •
Solar cell efficiency (n)
Solar simulator automatically determine the photovoltaic mechanism like monomolecular recombination mechanism, supra linear mechanism and etc.
SOLAR SIMULATOR SYSTEM measures the followings
Solar Simulator system is controlled automatically by computer
Solar Simulator system adjusts automatically the intensity of light 0.1 W/m2 -1000 W /m2 by any step, for example from 1 W/m2 to 1000 W/m2 with 1 W/m2.
Solar Simulator system automatically measures current-voltage (I-V) under various light intensities
Solar Simulator system automatically measures power-voltage (P-V) under various light intensities
Solar Simulator system automatically analyses photovoltaic mechanism (I-V) under various light intensities
TECHNICAL SPECIFICATIONS OF LSS AUTOMATIC SOLAR IV CHARACTERIZATION SYSTEM
- Solar Simulator system automatically is controlled by computer.
- Solar Simulator system automatically measure I-V characteristics from 1 W/cm2 -1000 W /cm2 by adjusting light intensity with step of 1 mW/cm2.
- The intensity of solar simulator should automatically adjust by solar IV system
- Solar simulator system should simultaneously measure I-V characteristics curve of the device, Solar Cell I-V characteristic curve, Power-voltage curve, lsc-Solar light intensity curve and photovoltaic mechanism curve and should analyze photovoltaic mechanism and write type of the mechanism on computer screen.
- Solar Simulator should automatically measure open circuit voltage Voc and short circuit current, ISC , Shunt resistance (Rsh) • Conversion efficiency (n), Maximum power output (Pmax), Voltage at Pmax (Vmax), characteristic resistance, Rch , Fill factor (FF) • Series resistance (Rs)
- Solar Simulator system measures automatically current-voltage (I-V) of solar cell under various solar lights
- System should have a source meter having the specifications
Voltage range: -10 V to +10 V
Current range: 10 nA to 150 mA
- System should have an automatic shuttering system which automatically changes solar light from 1 W/m2 to 1000 W/m2.
- System should have sample holder and it is comprised of two probes. Holder size should have 132.5mmx132.5mm.
- System should have software to control measurements and analysis of data.
- Installing and training
SOFTWARE OF THE SYSTEM
System has two software, first characterize all photovoltaic parameters
Software measure all photovoltaic parameters of solar cells by computer. The system determine all photovoltaic parameters. Software of Solar Simulator system determine the following photovoltaic parameters such as short circuit current Isc, open circuit voltage Voc, maximum power Pmax, maximum current Imax, maximum voltage Vmax, efficiency h, shunt resistance Rsh and series resistance Rs. Also ,system analyze the automatically the photovoltaic mechanism analysis.
Calibration Certificate
Product: Solar Simulator Model: X5 Solar Simulator SN: 32
Applicable Standards: ASTM E 72-10, EIC 60904-9, JIS C 8912
Spectral Match |
|
||||||||||||||||||||||||||||||||||||||||||||||
|
|
Band/Band |
|
Class A limits |
|
Error |
Status |
|
|||||||||||||||||||||||||||||||||||||||
|
400-500nm |
|
%25 |
|
|
-5.32% |
Pass |
||||||||||||||||||||||||||||||||||||||||
|
500-600nm |
|
%25 |
|
|
3.20% |
Pass |
||||||||||||||||||||||||||||||||||||||||
|
600-700nm |
|
%25 |
|
|
2.03% |
Pass |
||||||||||||||||||||||||||||||||||||||||
|
700-800nm |
|
%25 |
|
|
4.43% |
Pass |
||||||||||||||||||||||||||||||||||||||||
|
800-900nm |
|
%25 |
|
|
1.88% |
Pass |
||||||||||||||||||||||||||||||||||||||||
|
900-1100nm |
|
%25 |
|
|
2.42% |
Pass |
||||||||||||||||||||||||||||||||||||||||
Non-uniformity |
|||||||||||||||||||||||||||||||||||||||||||||||
|
Area |
Class A limit |
|
Non-uniformity |
Status |
||||||||||||||||||||||||||||||||||||||||||
|
40 mm diameter |
2% |
|
0.9% |
|
Pass |
|
||||||||||||||||||||||||||||||||||||||||
|
|
|
|
||||||||||||||||||||||||||||||||||||||||||||
Irradiance instability |
|||||||||||||||||||||||||||||||||||||||||||||||
|
Periyot/Period |
Instability |
Class A limit |
Status |
|||||||||||||||||||||||||||||||||||||||||||
|
STI |
0.5s |
0.30% |
0.5% |
|
Pass |
|
||||||||||||||||||||||||||||||||||||||||
|
LTI |
10Min |
0.88% |
2.0% |
|
Pass |
|
||||||||||||||||||||||||||||||||||||||||
|
|
|
|
||||||||||||||||||||||||||||||||||||||||||||
Approved
SOLAR SIMLUATOR perform the following tests
- Solar simulator automatically measure current –voltage (I-V) characteristics of solar cell from 10 W/m2 to 1000 W/m2 with any step of intensity in W/m2
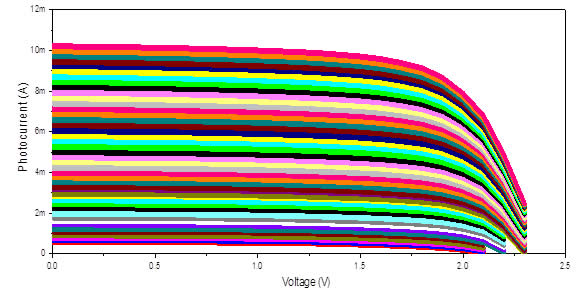
Current-voltage characteristics of solar cell under various solar irradiances
- Solar simulator automatically measure current –voltage (I-V) and power-voltage (P-V) chracteristics of solar cell from 10 W/m2 to 1000 W/m2 with any step of intensity in W/m2
JUST YOU CLICK START BUTTON on software
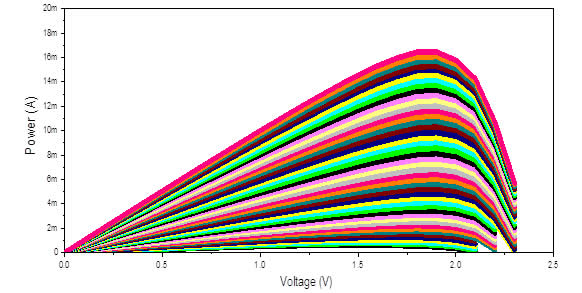
Power-voltage characteristics of solar cell under various solar irradiance
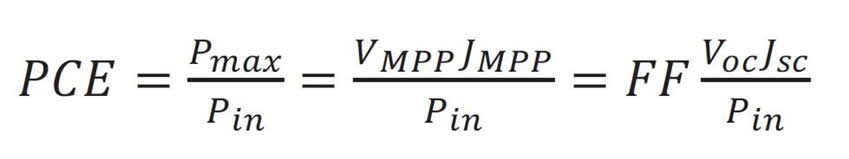
2. IV Curves - Power Conversion Efficiency of solar cell
The power conversion efficiency (PCE) of a solar cell is determined by performing a current−voltage (I−V) sweep under 1−sun intensity (1000 W m−2 illumination at AM1.5G).
The result is a curve, which crosses the voltage, x−axis at the point called open−circuit voltage (Voc) and the current, y−axis at the point called short−circuit current (Jsc). As clear from the figure below, the solar cell JV characteristics is not a square, which indicated that the power extracted from the device is less than the product of Voc and Jsc.
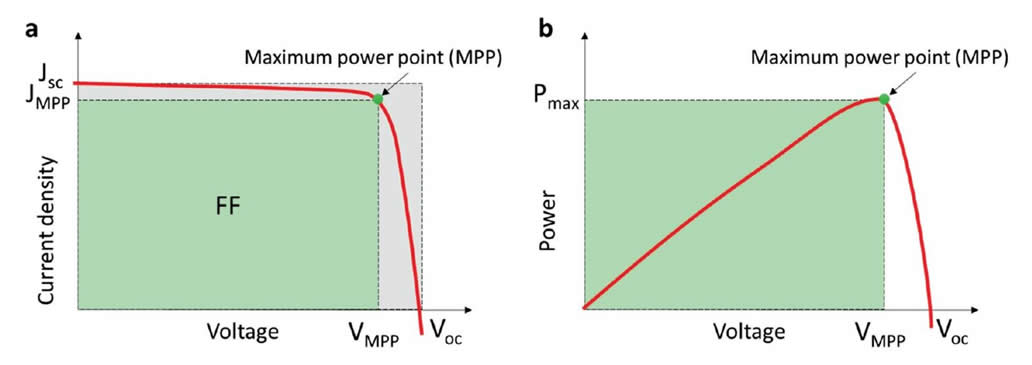
- Current-voltage (I-V) curve of a solar cell characterized under constant illumination. (b) power output as a function of the voltage
Instead, one has to determine the so−called maximum power point (MPP) − the point, at which voltage and current result in maximum power (Pmax) extracted from the device. FF, Voc, Jsc, and PCE are the most commonly used performance metrics to characterize solar cells.
This way of extracting PCE from a solar cell is normally independent of I−V scan direction and it works accurately as long as the measured solar cell is under quasi-steady-state conditions. This requires the device to be in equilibrium under each applied potential during the measurement.
Researchers found almost immediately that depending on the J−V scan direction, the result of the measurement was different. This phenomenon is called J−V hysteresis.
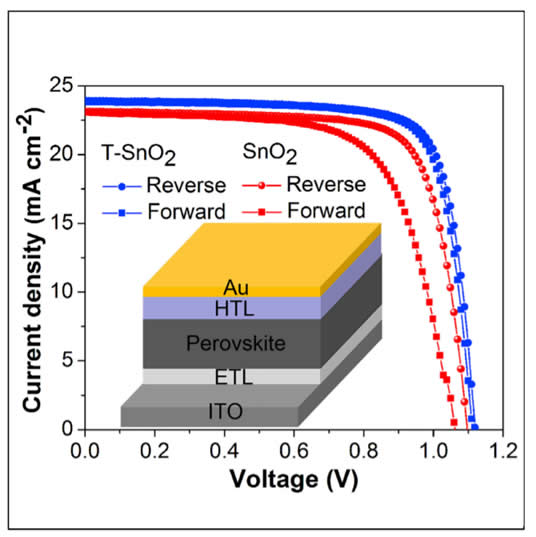
Hysteresis curve of solar cell
Moreover, the PCE depended additionally on the scan rate. Preconditioning under forward bias prior to the J−V scan was shown to improve the apparent efficiency of the devices, while the opposite effect was found when the devices were preconditioned under reverse bias. Hysteresis−free curves were obtained when the scan is performed either very fast or very slowly, but only in the latter case steady−state conditions can be achieved for the proper measurement of the PCE.
Soon after the discovery of J−V hysteresis, an intense discussion started on the origins of the phenomenon, and several explanations were proposed. Today, a broad consensus has been reached that the motion of ions (and their vacancies) in the perovskite is to blame for the J−V hysteresis. It is believed that halide defects (with their low formation energy in perovskites) can migrate and cause the J−V hysteresis observed on the timescale of seconds/minutes. The additional arguments for ionic origins of J−V−hysteresis include strong dependence on scan rate, pre−conditioning, temperature, and the sensitivity to device fabrication and aging.
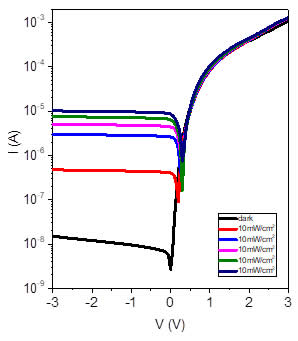
Dark current-voltage characteristics
The IV-curve is the default characterization technique for solar cells. The standard solar cell parameters short-circuit current, open-circuit voltage, fill factor and maximum power are easily extracted from the analysis of the JV characteristics. characteristics can be collected under dark or under different light conditions.
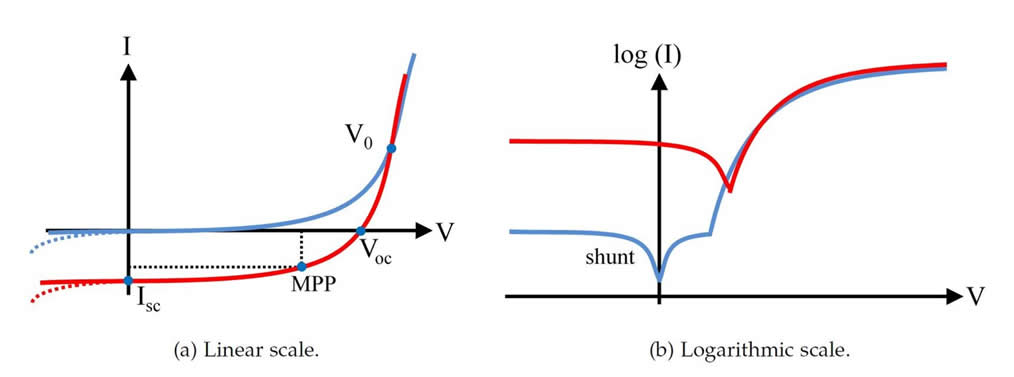
Figure 3.2: schematics of the dark and light current-voltage curve in linear and logarithmic scale. the parameters mentioned in the text are indicated.